Detailed Procedure : ProfiTrace for Commissioning
Full procedures is as follows :-
1) Connect your ProfiCore Ultra (PROFIBUS to USB adapter) to the intended PLC/ Master end of your network and to your computer, if necessary adding extra PROFIBUS cable to ensure 3 metre length to first slave (to enable later Topology Scan).
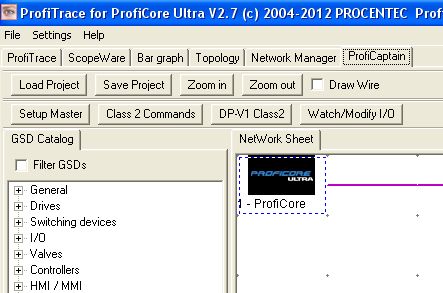
2) Start the ProfiTrace program, then click on left Init. ProfiCore Ultra button to start the ProfiCore. Click OK button when program reports that it is unable to detect baud rate. On completion of start-up, click on the top ProfiCaptain tab.
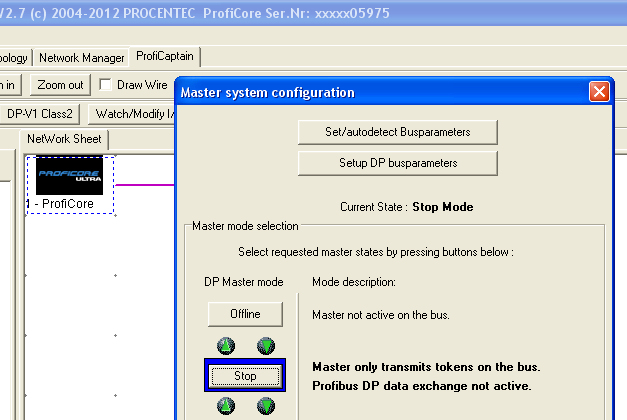
3) In the ProfiCaptain screen (as above), click on left Set-up Master button (or double click on central black ProfiCore image), then click on Stop button in resulting Master System Configuration window (see below). Close that window.
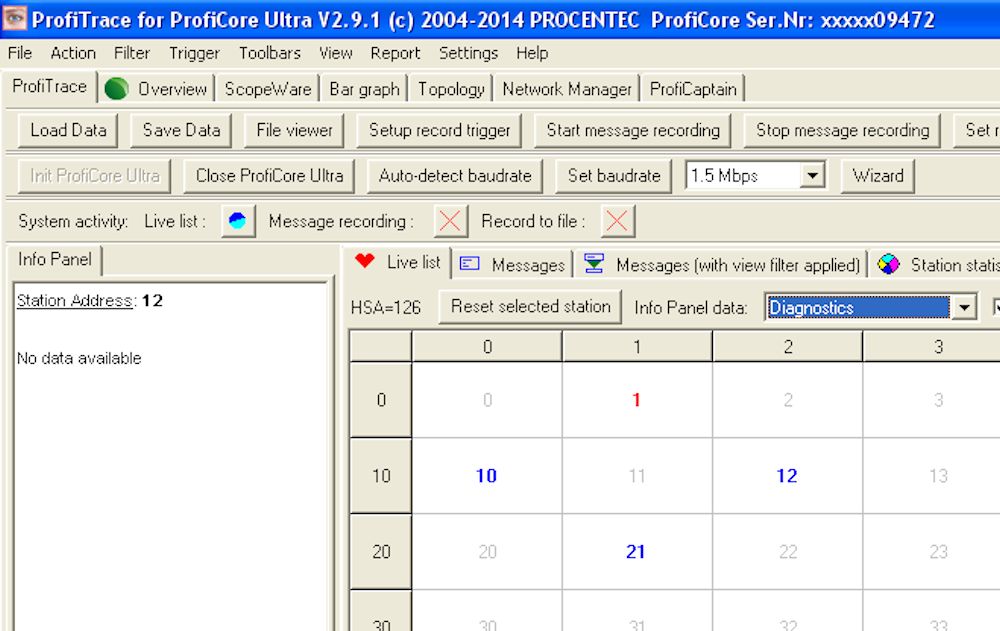
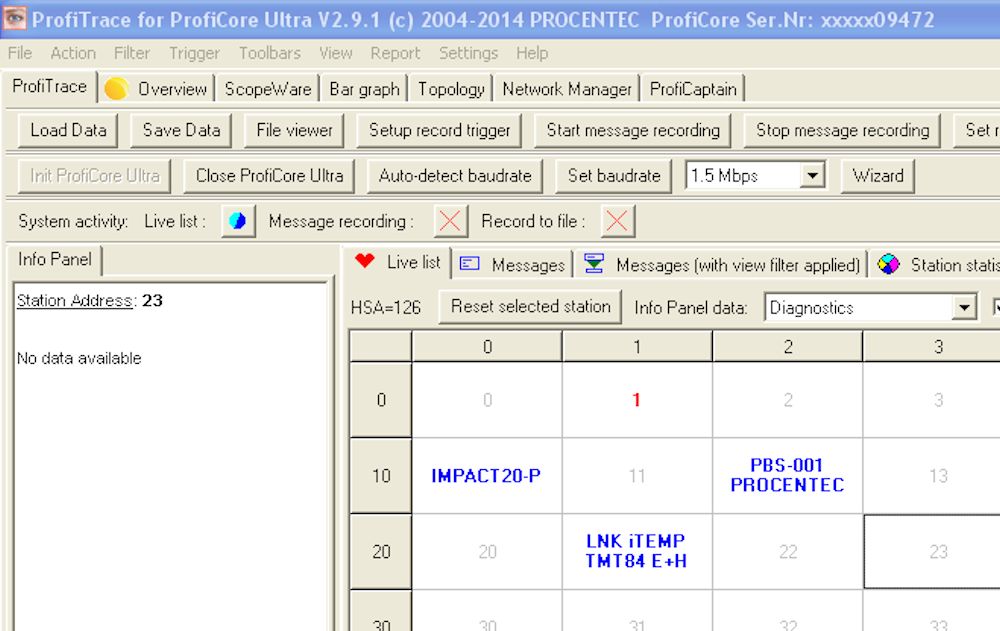
4) Select top left ProfiTrace tab, to see Live List display, with red number 1 for ProfiCore Master and blue digits at address positions for any other connected and powered slave devices (as below).
5) Select top of screen Bar graph and ScopeWare tabs to inspect driver voltages and waveforms from all devices, particularly checking in the ScopeWare display that the left ‘idle voltage’ trace (before message start bit) is at approx 1 volt, confirming that 2 terminators are set. (For ScopeWare waveform synchronisation, double click on each device address tile in lower screen Live List)
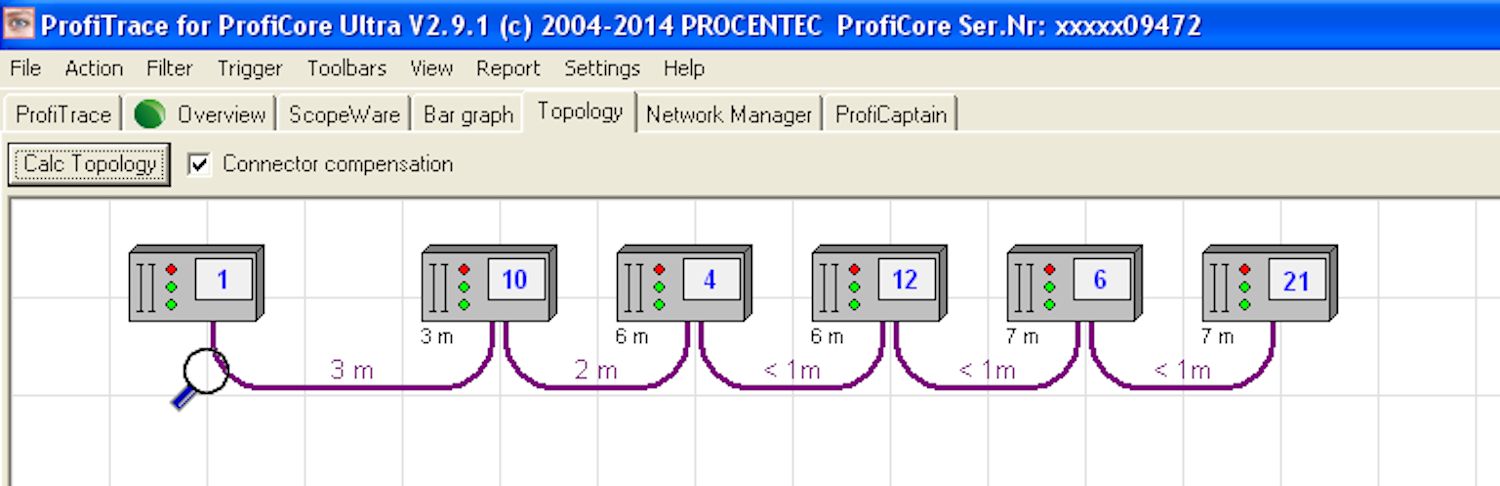
6) For immediate device sequencing and cable length report, select top of screen Topology tab, then click on left hand Calc Topology button. In following dialogue window, select Using ProfiCaptain as master (no PLC active) option then click OK to start the scan. Note that any devices beyond repeaters or OLMs ( Optical Link Modules) will be shown at the repeater module distance from the ProfiCore.
7) To see further details of connected devices, ensure that you have copies of all required GSD files available in the GSD folder for this computer, return to ProfiTrace screen, selecting top of screen Settings, then Scan GSD Library – on completion select the ProfiCaptain tab again. In the ProfiCaptain page, click left hand Class 2 Commands button and in ensuing Class 2 commands dialog window, click on the top Start Scan button to check for details of all connected slaves. On complete close this window, returning to the ProfiTrace Live List page where further details of all detected slaves should now been shown in blue characters on a white background (as in following screen image). Where associated GSD files are found, manufacturer and device types may well be shown, but where associated GSD files are not found only the device ID code will be shown as 4 hex characters – this code may then be used in an Internet search for further information and copy of associated GSD file which may then be added to your ProfiTrace GSD library.
8) Note that, at time of writing, with ProfiTrace V2.9.1 software, the above Class 2 Scan will cause display of amber (orange) network status on top of screen Overview tab. Do not be tempted to select this tab and the offered Reset button option as, in addition to changing the status indication to green, this will also clear the device information collected above!
9) Printed Report : all of the network layout and device information collected above may next be recorded in a printed report at this point, by selecting top of screen Report tab and entering requested Location, Network, Engineer and Company names, together with optional Project and Remark comments. Before clicking on the lower left corner Generate Report button, you can select top of window Custom Logo tab to allow uploading of a company logo for display at top right corner of each Report page. If you have successfully completed all of the above procedures, your resulting report will include front summary page, including report date, project, site, engineer and other set-up details, listing of all connected devices, together with network address for each, manufacturer name, model details and associated GSD file names. After this it will include Live List, Bar graph and Topology scan results, then ScopeWare waveforms for messages from all devices. Resulting reports may be saved within your computer but will need access to a (free) PDF writer program for printing – PDFill or similar are recommended by Procentec.
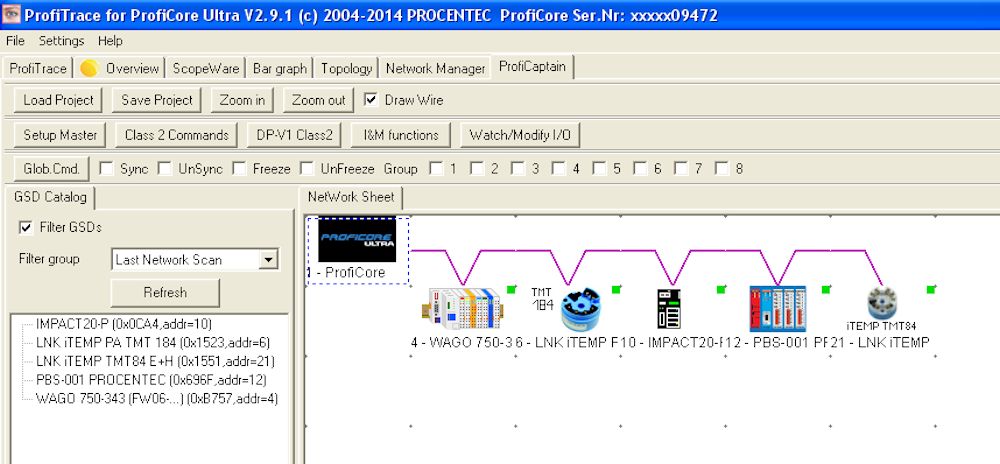
10) Data Exchange : If you have a full ProfiCaptain licence to run PROFIBUS Master software on your ProfiCore, you may use this to bring all connected devices (for which you have GSD files) into data exchange to further confirm correct operation of each, prior to availability of the intended PLC/Master. This can most easily be done, after above Para 7 sequence, by returning to the ProfiCaptain page and clicking the Filter GSDs box, followed by selection of the Found in Live List or Last Network Scan options in the offered Filter Group drop list – then click on the Refresh button. This will return a list of detected slaves below, each with device type information, ID number and network address (as in following screen image, after Para 12). (Note that Generate Catalogue option will first need to have been completed within ProfiCaptain page, under the top of screen Settings menu)
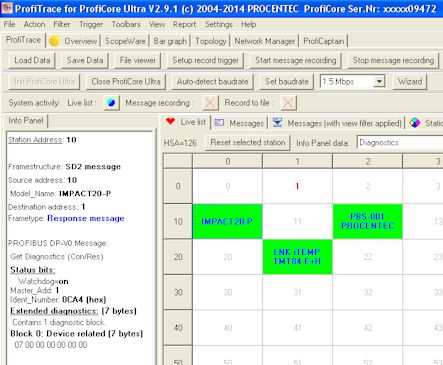
11) Each of the offered devices may then be highlighted, dragged across into the right hand NetWork Sheet and dropped into clear space just below the offered PROFIBUS cable line. You must then double click on the offered device icons for each, one at a time, to launch an associated Slave Setup Dialog window, in which you must first set the correct slave address. Next click on the Setup Module & Parameters button, selecting one or more of the modules shown in the lower left corner Available Modules list which correspond to the particular version and configuration for that device that you have running at that particular network address. When required configuration details have been selected, click lower OK button for return to the Slave Setup Dialog window, before clicking on the Active box and finally clicking on lower OK button to complete set-up for that slave.
12) When all required slaves have been configured in this manner, double click on the black ProfiCore Ultra icon to see the Master System Configuration window again then, if necessary click on the top Offline button (to end Stop mode) then click on the lower Operate button to start your ProfiCaptain master and bring all required slaves into Data Exchange. Success will be shown by small square flag areas at top right corner of each slave icon changing from black to green (as in following screen image). Brief return to the ProfiTrace Live List page should further confirm success, with expected slaves there shown with device detail legends now printed over green backgrounds.
13) The ProfiCaptain Watch/Modify I/O button may then be used to access the associated dialog window for setting digital output patterns to selected device channels, one at a time. For this you need the output memory address for each device, as shown in the lowest panel of the ProfiCaptain display, with the Memory tab selected for each required device. A range of automatic digital test patterns may be applied from increase, decrease, bit zig-zag, bit walk or copy input to output, with update periods selectable from 50 mSec up to 2 seconds. You may also set specific binary patterns and output these in manual mode to any required slave. Refer to the ProfiTrace Handbook for further details. Multiple Watch I/O lines may be added, each with different output patterns, updating at different speeds, with one for each available slave output port.
14) Data Inspection : The ProfiTrace page Data Inspection tab may be used for real-time display of output and input data values, sent to or returned from each slave device. Separate lines may be added for different ports of each slave, with scope for off-set and scalings to be applied to each and explanatory annotation shown to the right. If the Live List ColourCoding box is ticked in this screen, you can add Live List type details for each slave on a green background (assuming normal data exchange).
15) Save Settings : Note that most of the more complex set-ups explained above can be saved within ProfiTrace for later use. For example in ProfiCaptain you can save and reload each project, in Watch I/O you can save and restore complete watch lists and in Data Inspection you can save and reload inspect settings. These allow rapid return to previous work, and are particularly useful for safely saving successive build-up, or alternative versions, of complex network tests, or for saving and quick set-up of frequently used demonstrations.
Please let us know if you find this page useful, and any enhancements (or corrections) which you would like to see!