ProfiTrace V2.7.1 Software Upgrade
(Note : before undertaking the following procedure, it is recommended that you locate, download and install the free Procentec ComBricks Network Condition Indicator Program, which is available from www.procentec.com)
Procentec ComBricks is a flexible, modular, range of PROFIBUS repeaters offering extensive network performance monitoring and 24/7 local data logging facilities for remote access via the inbuilt Ethernet port. In order to help understand more about these exceptional products, the following notes explain how to quickly start using a basic ComBricks kit for performance monitoring and logging for a single PROFIBUS network.
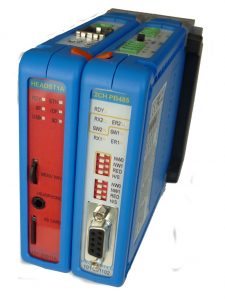
This Quickstart guide is based on using an Eco Monitoring kit, approximately as shown below, consisting of a red fronted Head Station and one single channel Repeater module (although two channel repeater shown in this photo!).
 The kit allows checking and reporting on the status of a single PROFIBUS network, but alternative modules allow for the wider monitoring and data logging for up to 4 different PROFIBUS networks at a time.
In all cases, required network event data is saved to local memory chip if and when the selected events occur. Alert reports may also be emailed over the Ethernet link to highlight significant changes. Hardware alarm may also be tiggered from internal relay contacts . Live and stored network status information can be seen at any time by browser access to the integrated COMbricks web server, using the Head Station IP address.
Connection is needed directly into PROFIBUS cables of the required network, with only minimal loading and no network address or programming needed. The new device will be invisible to the network Masters, much as if using ProfiTrace on a convenient piggy-back connector. If you need to mount the COMbricks kit away from the required network, you can easily do this using a Procentec Single Channel B1 PROFIBUS Repeater which will create a safe, full specification, PROFIBUS DP spur to the COMbricks kit. The B1 Repeater is also DIN rail mounted, needing 24 volt DC power and is supplied with all required removable screw connectors, for both power and PROFIBUS cables.
The above COMbricks kit needs about 7 cm of DIN rail space in your PROFIBUS cabinet, access to 24 volt DC power, scope for adding a short extension onto your PROFIBUS cables and maybe access for patch lead connection onto your site Ethernet LAN, if locally available. PROFIBUS cable connections are made using supplied screw terminal connectors, or with network data connection onto the front panel 9-pin PROFIBUS connector of the repeater module.
The recommended basic COMbricks Eco Monitoring kit includes a Head Station and 1 Channel PROFIBUS Repeater (although illustration above shows a 2 Channel Repeater). The Red Head Station module has an RJ45 connector for Ethernet link, two separate DC power connectors (for optional redundant supplies) and a micro-SD memory card to save set-up details, status logs and recorded network status messages. The Repeater takes DC power from the adjacent Head Station and, in the case of a single channel repeater, has two plug-in screw connectors on the lower edge for PROFIBUS segment connection, with associated terminator switch, and a front panel 9-pin D-type connector for this lower Channel. Additional front panel slide switches, visible on red backgrounds in above photo, determine how each incoming segment is to be connected to the internal back-plane for automatic monitoring by the Head Station and possible onward connection to new output segments using addition modules or channels.
In our above illustration, we show a 2 Channnel Repeater, with additional PROFIBUS connectors on top edge, allowing for connection of a new outgoing segment from the monitored incoming segment on lower channel.
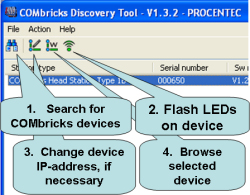
Once 24 volt power is applied to the COMbricks kit, link your PC computer Ethernet socket with a Cat 5e patch cable to the COMbricks Ethernet port. Cross-over patch lead is not usually needed. Start the ComBricks Network Condition Indicator (NCI) program, then on the front screen click on the lower Add... button to start search for the newly started ComBricks Head Station. At top left corner of the follow-on Select ComBricks window, click on the offered Discover Devices button to launch the Discovery Tool program, as shown in following illustration. Next click on the left hand search icon of the Discovery Tool window, which should soon add a single display line for any operational COMbricks kits located on your LAN. Each such line shows the head station name (if set), Head Station firmware type (1A, 1B or 1C), device serial number and the MAC and IP addresses and device uptime.
 After selecting a required COMbricks report line, the Discovery Tool flash button may be used to trigger brief illumination of all Head Station LEDs on that particular device – so confirming successful contact with the unit.
Further icons on the Discovery Tool program toolbar may then be used to launch your web browser to view device status, if necessary first changing the device IP-address using an offered dialogue. Your connected computer for these activities will need to be running with IP address in same range as that of the new ComBricks Head Station, or IP address of the ComBricks changed to same range using the Discovery Tool application, to allow successful linking to the ComBricks Head Station web server.
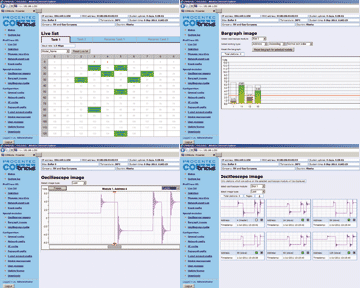
If selected the COMbricks web server page normally starts at the Status Screen. Thereafter one can view other menu options and, once your Head Station is connected to at least one live PROFIBUS network, one may open the Live List and Statistics pages for display of live network status information in a very similar style to that shown by ProfiTrace. The following illustration shows typical display formats, including those from an alternative Scope Repeater, which is needed for both the bar-graphs and waveforms shown here.

For more comprehensive details of the various COMbricks web server pages click on the following link to view the Procentec Live COMbricks demo page
..and/or for introduction/explanation to/of this Procentec ComBricks demo see our following ComBricks Demo Explanation webpage.
Handbook information for the whole ComBricks range available in latest version of the Procentec COMbricks User Manual